Histogram - Table Generators Bring the power to quickly and easily Generate tuning tables and maps based on the data in your logs.
See exactly how far off every cell of you fuel table is by processing all the data in your logs.
You can plot your spark or AFR table, see where in on the maps knock is occuring. The uses are endless and limited only by the data in your logs.
Using a standard BigComm Pro data logs or Replays these Histograms are generated.
The X & Y Axis are full customizable, generate any size tables as needed to match your system and use filters to discard outlying data.
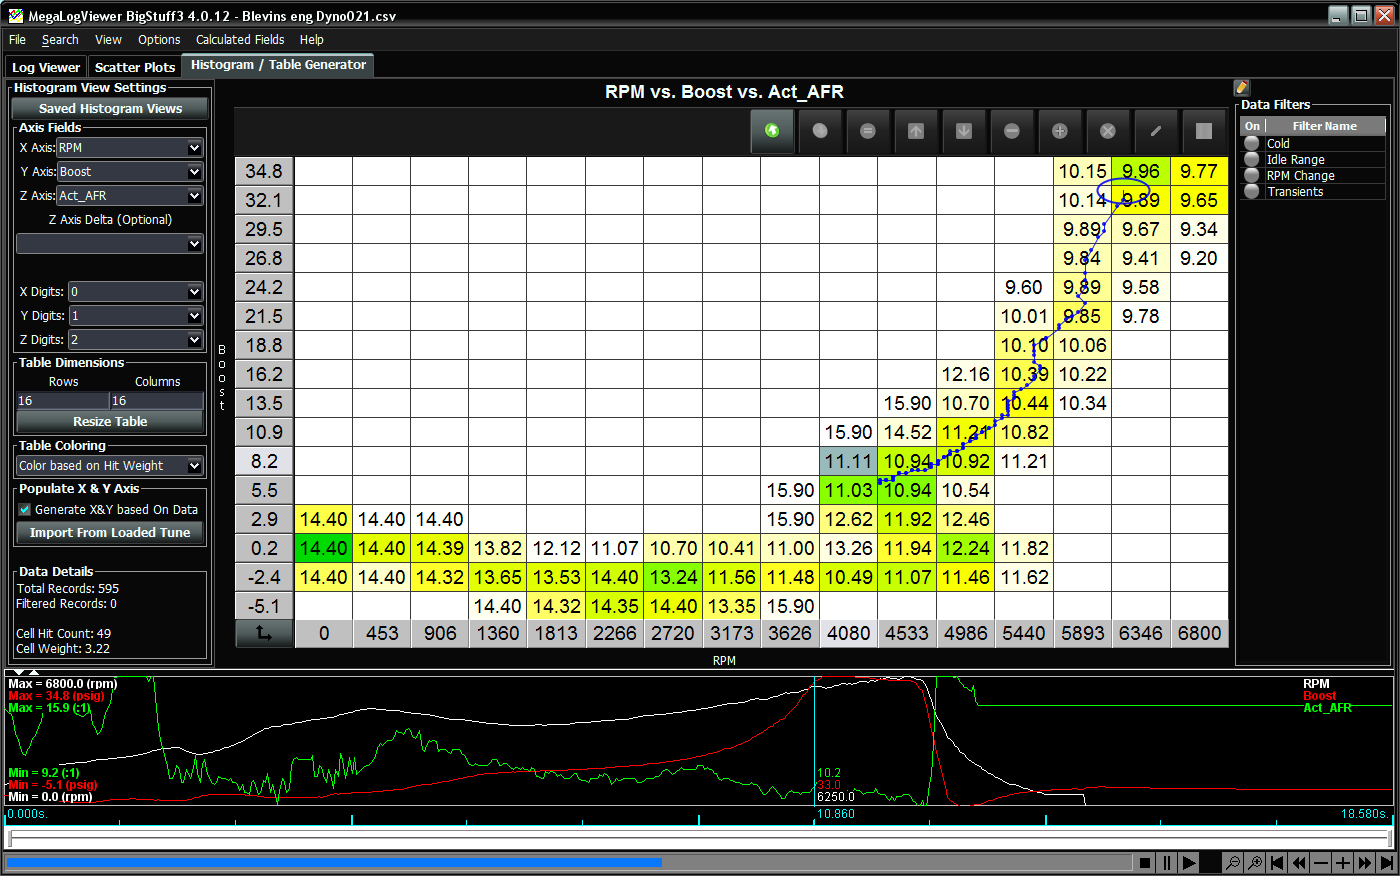
RPM vs. MAP vs. Act_AFR
A Histogram that shows what AFR the engine was running at in each of the cells on the table.
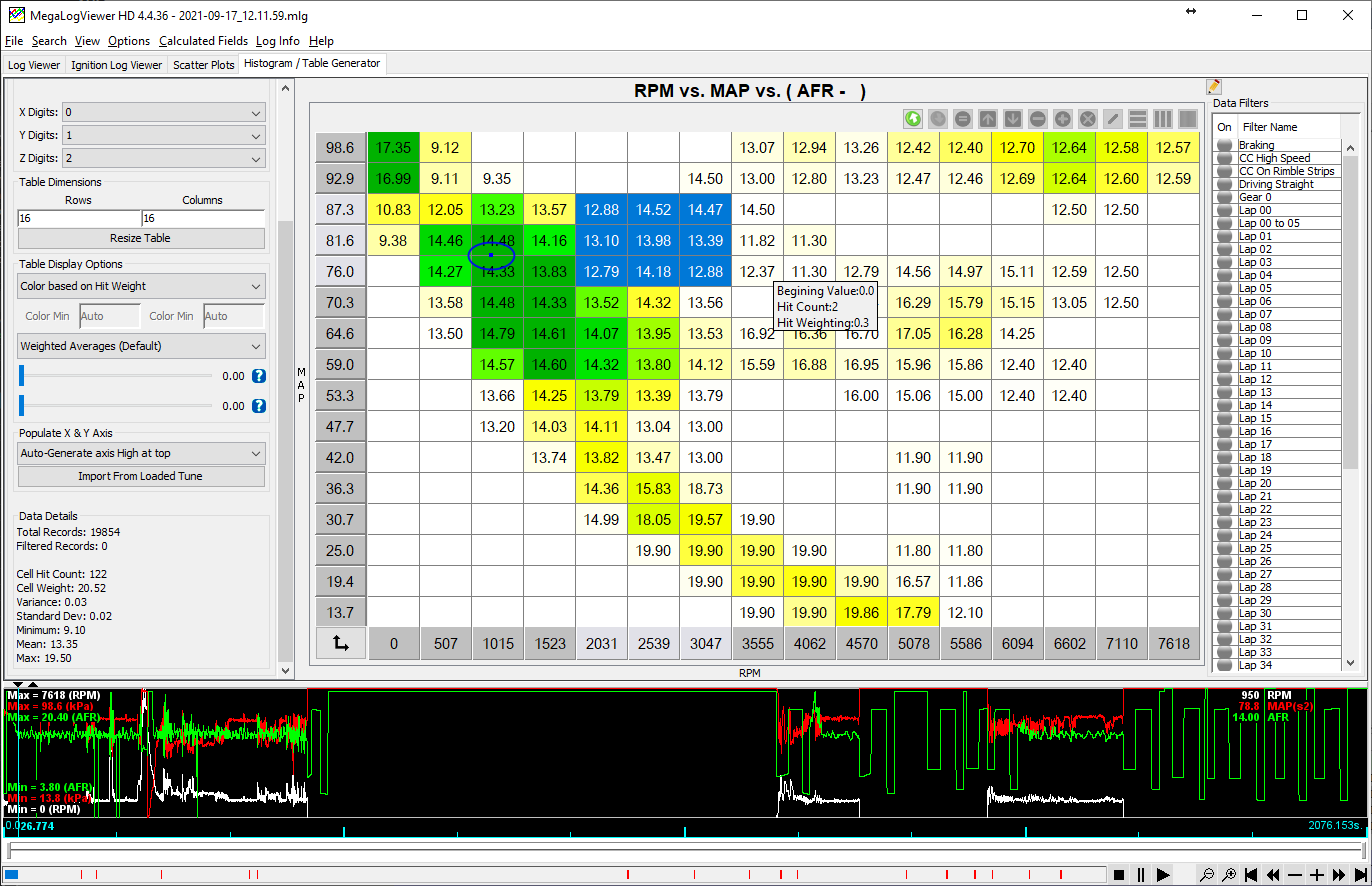
Or a longer data log captured across broader engine conditions:
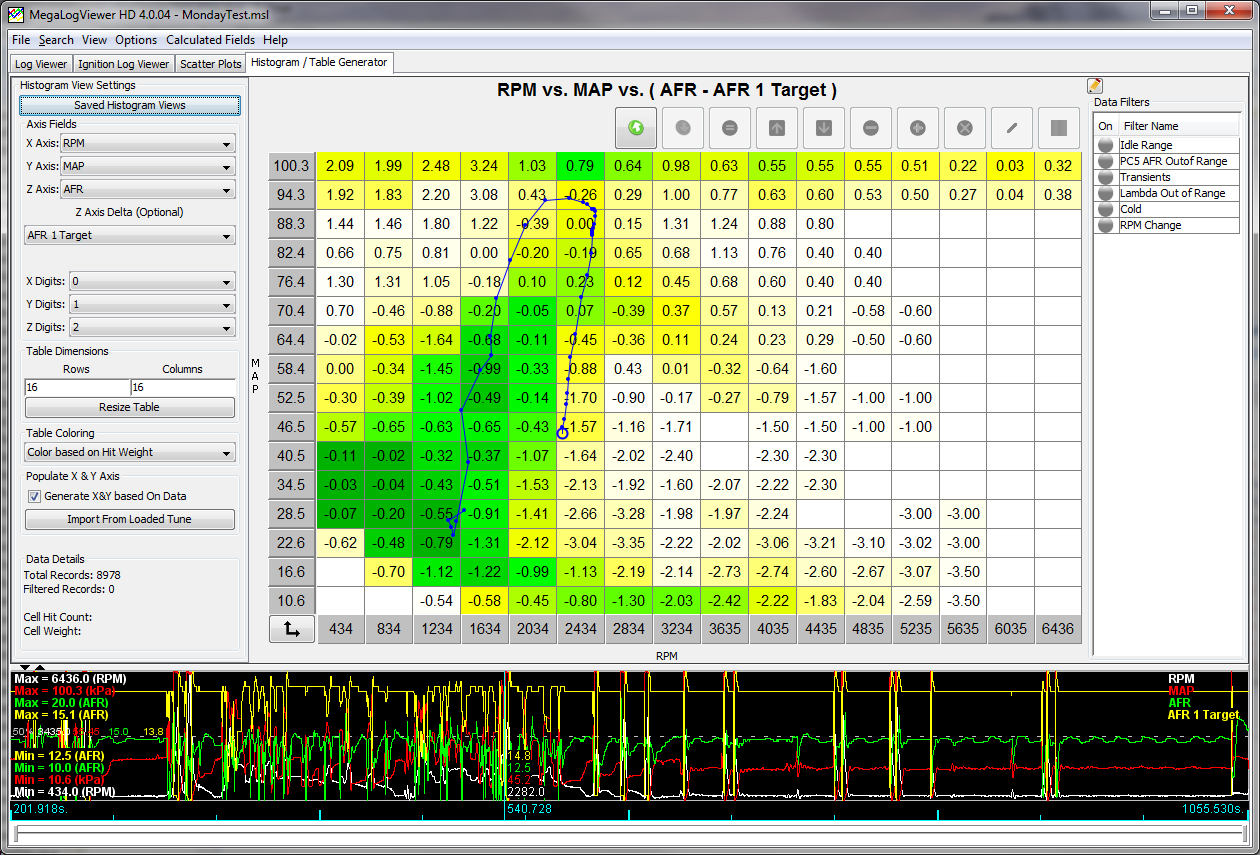
RPM vs. MAP vs. (AFR - AFR Target)
Taking that step further, with a log including target AFR, you can set that up as a Z delta field. With a Z Delta Field, then the generated table shows the difference between the Z field and the Z delta, in this case that means a table that represents how far off your engine was running from the target AFR in each cell.A Histogram that shows what AFR Error was ocurring in each of the cells on the table.
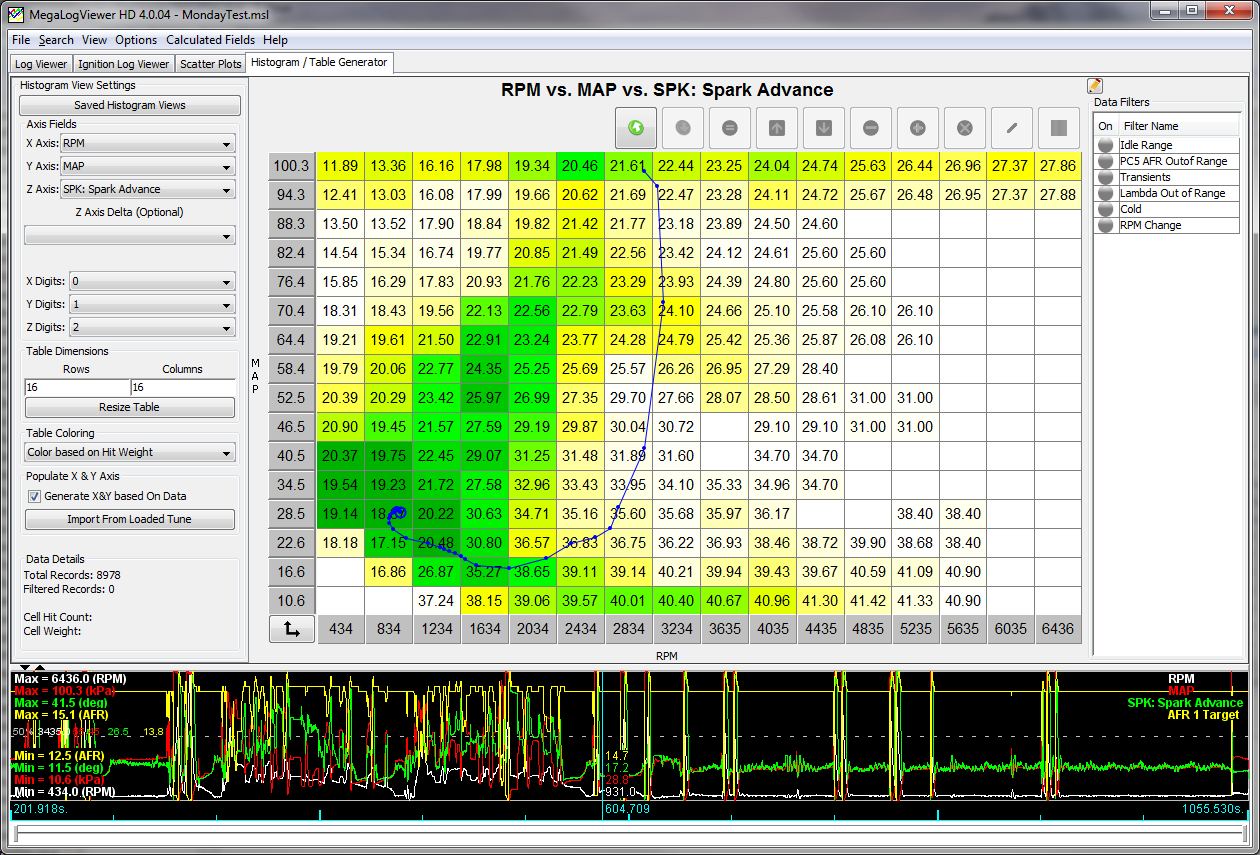
RPM vs. MAP vs. Spark Adv
A quick simple view to show how quickly you can see exactly what spark timing the engine is running at in each cell.